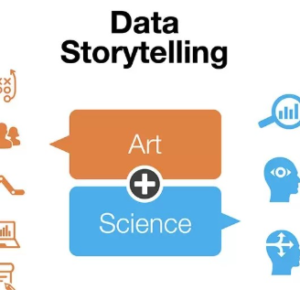
The Power of Data Storytelling: Transforming Raw Data into Engaging Narratives
In today’s digital world, data is everywhere. Businesses, researchers, and marketers rely on data to make informed decisions, but raw data alone is not enough. To truly make an impact, data must be transformed into compelling narratives—this is where data storytelling comes into play.
Effective data storytelling combines analytics, visualization, and narratives to help audiences understand and engage with data-driven insights. Whether you’re a business analyst, marketer, or content creator, mastering data storytelling can enhance decision-making, improve communication, and drive action.
Why Data Storytelling Matters?
Data storytelling is more than just charts and numbers—it’s about making data relatable, understandable, and actionable. A well-crafted data story can:
Improve Decision-Making – Helps stakeholders make informed choices based on real insights.
Engage Audiences – Captures attention with compelling narratives.
Simplify Complex Data – Breaks down large datasets into easy-to-understand insights.
Drive Business Success – Enhances marketing, sales, and operational strategies.
The Three Pillars of Data Storytelling
To create an impactful data story, you need to combine three key elements:
| Pillar | Description | Example |
| Data | Raw facts, statistics, and analytics. | Sales reports showing a decline in revenue. |
| Narrative | The context that gives meaning to the data. | A story explaining how customer preferences changed. |
| Visuals | Charts, graphs, and infographics to illustrate insights. | A line graph showing revenue trends over time. |
Integrating these three components transforms data from dry numbers into engaging, actionable insights.
How to Craft an Effective Data Story?

1. Define Your Audience and Objective
Before diving into data, understand:
- Who is your audience? (Executives, customers, employees?)
- What action should they take after viewing your data?
For instance, a financial analyst presenting revenue trends to stakeholders will need a different storytelling approach than a social media manager analyzing engagement metrics.
2. Choose the Right Data
Not all data is relevant—filter through unnecessary information and focus on key insights.
- Ask: What message does the data convey?
- Use reliable sources to maintain credibility.
Example:
A marketing campaign analysis may focus on conversion rates rather than general traffic data.
3. Structure Your Data Story Like a Narrative
Think of data storytelling as telling a real story, complete with a beginning, middle, and end.
| Storytelling Stage | Purpose | Example |
| Introduction | Presents the data and context. | “Over the past year, our online sales have fluctuated significantly.” |
| Conflict/Analysis | Highlights the key insights or problems. | “Data shows a decline in sales due to low engagement in Q3.” |
| Resolution/Takeaways | Provides solutions or next steps. | “We recommend investing in personalized ads to boost engagement.” |
Using this approach ensures a logical flow and makes data easier to digest.
4. Use Visuals to Enhance Understanding
Data visualization is a crucial part of storytelling. Well-designed visuals help:
– Make complex data easier to interpret.
– Highlight trends and patterns.
– Improve audience retention.
Best Data Visualization Methods
| Type of Visualization | Best For | Example |
| Bar Charts | Comparing categories or trends. | Sales by region. |
| Line Graphs | Showing trends over time. | Website traffic growth. |
| Pie Charts | Displaying proportions. | Customer demographics. |
| Heatmaps | Highlighting density or frequency. | Click-through rates on a webpage. |
Tip: Keep visuals simple and uncluttered—avoid overloading graphs with too much information.
5. Add Context and Real-World Examples
Data is meaningless without context. Instead of just displaying numbers, explain why they matter.
Example: Data Without Context
“Website traffic dropped by 20% in Q3.”
Example: Data With Context and Storytelling
“Website traffic dropped by 20% in Q3, coinciding with the removal of free shipping offers. This suggests that free shipping plays a crucial role in customer retention.”
By adding context, the audience understands why the data is important and what actions to take.
Best Practices for Data Storytelling
Keep It Simple – Avoid jargon and overly technical explanations.
Use Real Data – Ensure accuracy and credibility.
Focus on Key Insights – Highlight only the most relevant points.
Make It Interactive – Use dashboards and infographics for engagement.
End with a Call-to-Action – Clearly state what steps should be taken next.
Challenges in Data Storytelling
Even with the right techniques, some challenges exist:
| Challenge | Solution |
| Too Much Data | Focus on key metrics that matter. |
| Complex Data Sets | Use visuals to simplify information. |
| Lack of Engagement | Craft a compelling narrative. |
| Data Misinterpretation | Provide clear explanations and context. |
By overcoming these obstacles, data storytelling becomes more effective and impactful.
Real-World Example: Data Storytelling in Action
Case Study: E-Commerce Sales Decline
Scenario:
An e-commerce company noticed a 10% drop in sales over three months and needed to identify the cause.
Data Analysis:
1️ Sales Reports showed the decline started after the company changed its return policy.
2️ Customer Feedback revealed frustration over stricter return conditions.
3️ Website Analytics showed increased cart abandonment rates.
Data Storytelling Approach:
- 📊 Visual: A line graph depicted the sales decline post-policy change.
- 📖 Narrative: “Customers are abandoning purchases due to stricter return policies, impacting revenue.”
- 🎯 Solution: “Reintroduce flexible return options to regain customer trust and sales.”
Outcome:
By applying data storytelling, the company reinstated its previous return policy, leading to a 15% sales recovery.
Future Trends in Data Storytelling
🔹 AI-Driven Storytelling – Automated tools generate insights and narratives from raw data.
🔹 Augmented Reality (AR) & Virtual Reality (VR) – Enhancing data visualization through immersive experiences.
🔹 Personalized Data Stories – Custom insights tailored to individual users.
🔹 Real-Time Storytelling – Live dashboards that update automatically.
Data storytelling will become more dynamic, interactive, and essential for decision-making as technology advances.
Getting Started with Data Storytelling
Want to improve your data storytelling skills? Here’s a step-by-step guide to get started:
1️ Learn Data Visualization – Explore tools like Tableau, Power BI, and Google Data Studio.
2️ Practice with Real Data – Use public datasets from Kaggle or Google Dataset Search.
3️ Follow Experts – Read blogs, books, and case studies on data storytelling.
4️ Experiment with Different Formats – Try reports, dashboards, presentations, and infographics.
5️ Seek Feedback – Share your data stories with peers and refine them based on feedback.
Final Thoughts: The Art of Data Storytelling
In a world overflowing with data, the ability to tell meaningful, engaging stories from information is an invaluable skill. By mastering data storytelling, you can inform, persuade, and inspire your audience with data-driven insights.
Whether you’re presenting business reports, marketing analytics, or research findings, turning data into stories will elevate your impact and drive real-world change.
Are you ready to transform your data into compelling narratives? Start today and take your data storytelling to the next level!


